Cashflow
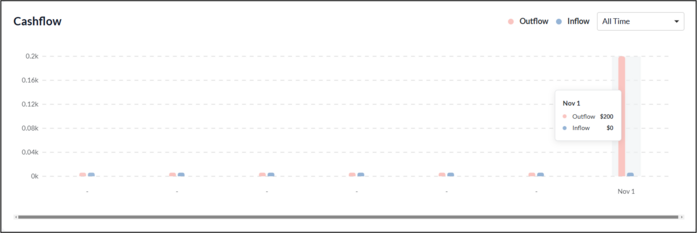
The Cashflow panel displays a bar chart with months on the X-axis and amounts on the Y-axis. Two distinct color codes represent the cash inflow and outflow for each month. Hover over the bar chart for any month to view detailed inflow and outflow data. You can filter the details for specific time periods, such as all time, last year, last 6 months, last 30 days, or last 7 days, using the drop-down menu.